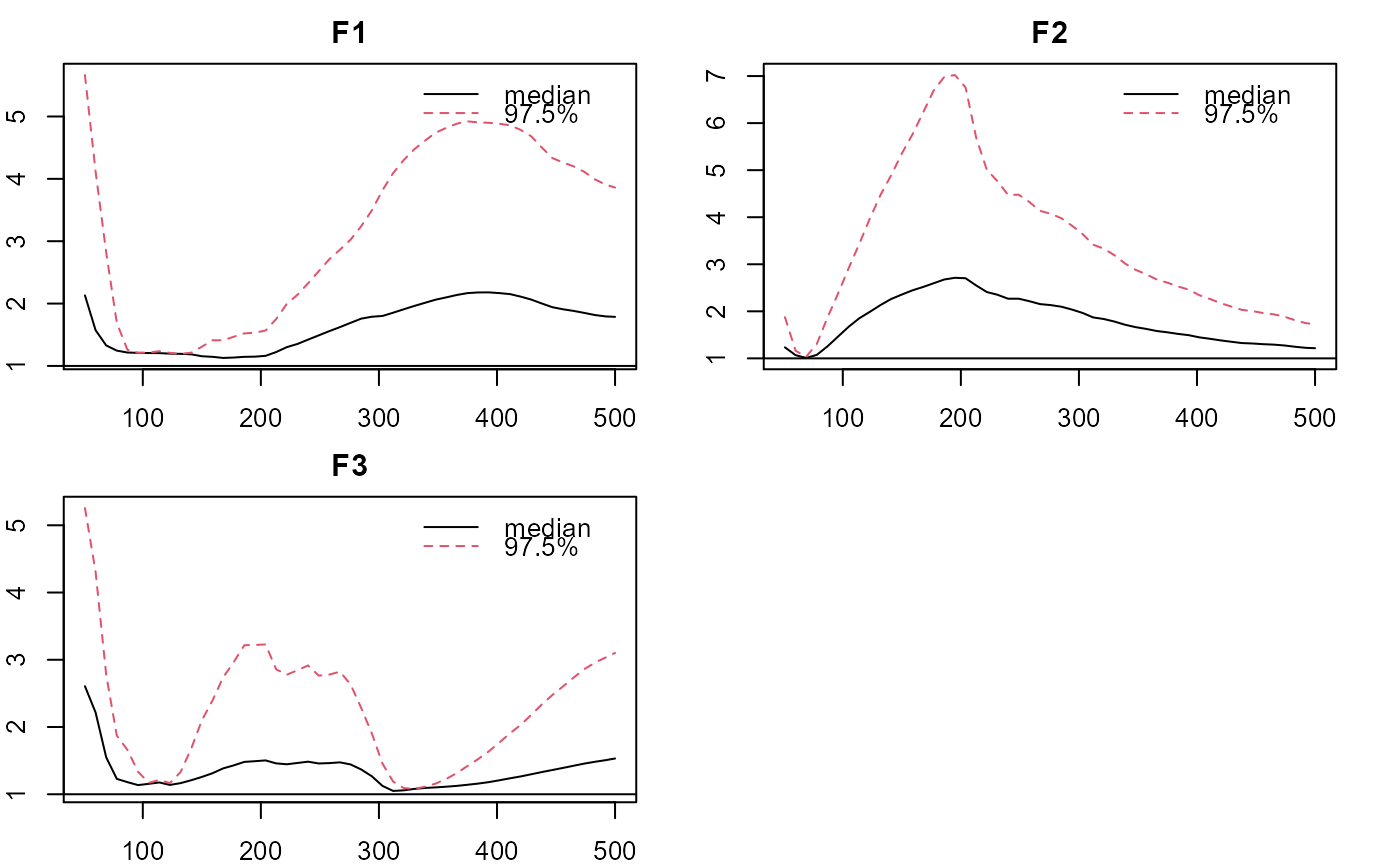
Provide plots based on the factorial eigenvalues of a pcfa objects.
plot_eigen(obj, what = "trace")
Arguments
| obj | A |
|---|---|
| what | A list of options for what to plot.
|
Examples
# \donttest{ dat <- sim18cfa0$dat J <- ncol(dat) K <- 3 Q<-matrix(-1,J,K); Q[1:2,1]<-Q[7:8,2]<-Q[13:14,3]<-1 m0 <- pcfa(dat = dat, Q = Q, LD = FALSE,burn = 1000, iter = 1000) plot_eigen(m0) # traceplot_eigen(m0, what='density')plot_eigen(m0, what='APSR')# }